mbeva
mbeva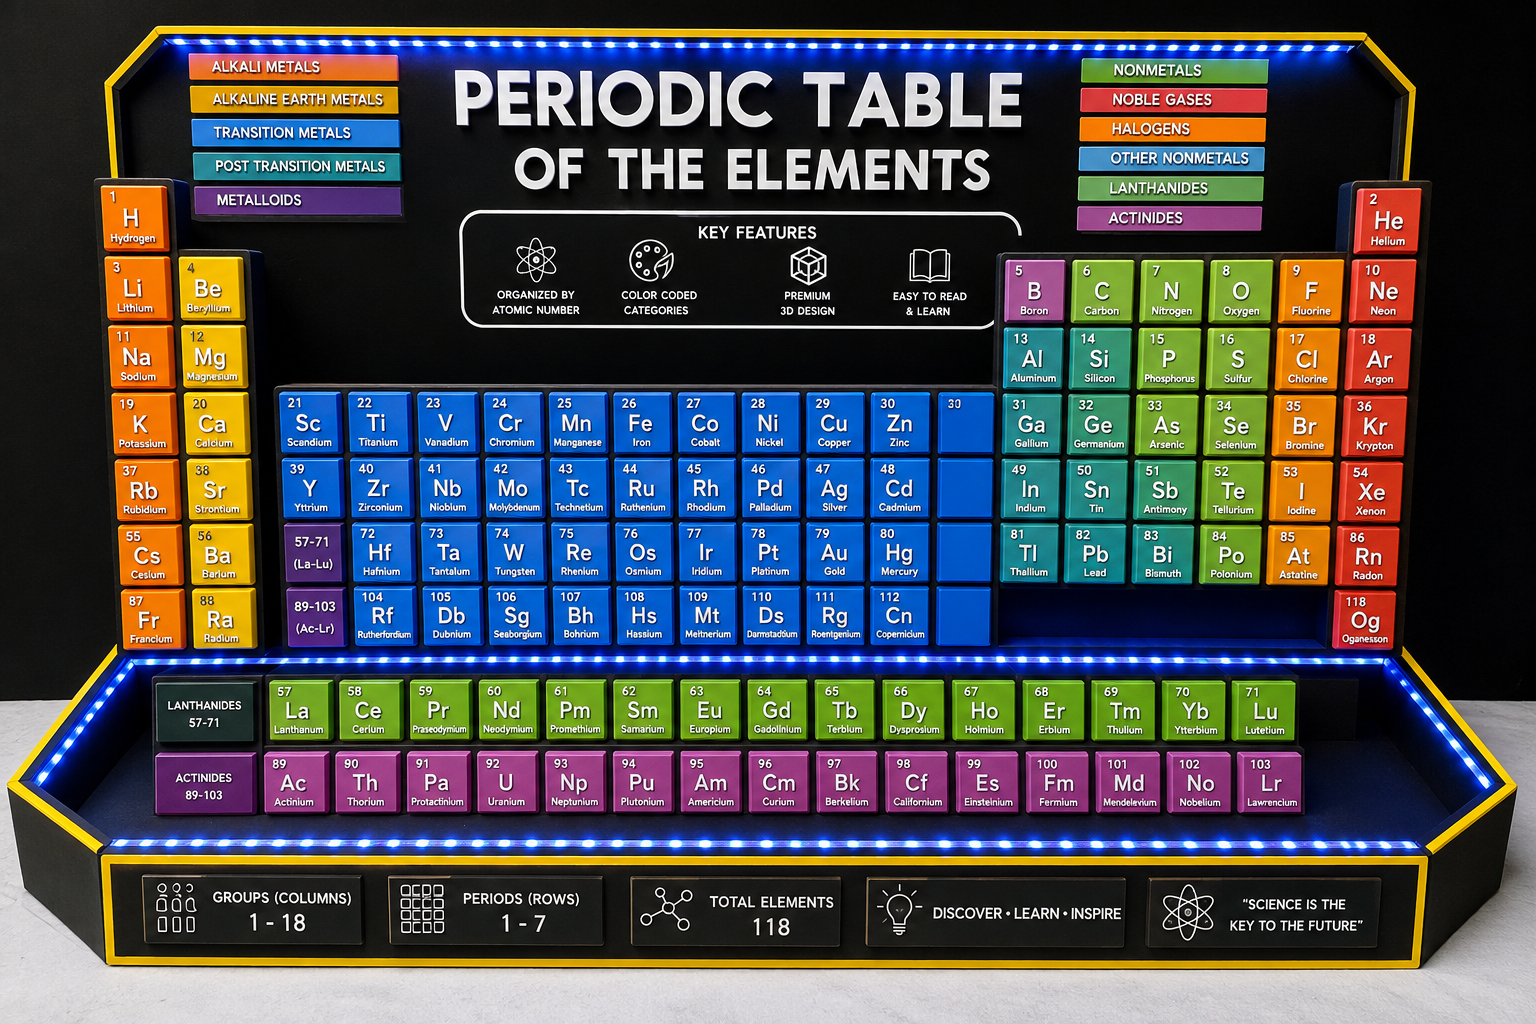
Meta Title: How to Make a Periodic Trends LED Board Using Arduino and LEDs
Meta Description: Learn how to build a Smart Periodic Trends LED Board using Arduino, RGB LEDs, and push buttons to visualize atomic radius, electronegativity, ionization energy, and metallic character trends.
Understanding periodic trends is one of the most challenging areas in Grade 10 Chemistry. Many students struggle to visualize how properties such as atomic radius, ionization energy, electronegativity, and metallic character change across periods and groups.
A Periodic Trends LED Board solves this problem by using LEDs to visually demonstrate these trends in an interactive way.
This project combines Chemistry, ICT, Engineering, and Applied Technology, making it an excellent project for STEM exhibitions .
Quick Answer: System Wiring Diagram
| Component | Pin | Arduino Pin |
|---|---|---|
| Push Button 1 | Atomic Radius | D2 |
| Push Button 2 | Electronegativity | D3 |
| Push Button 3 | Ionization Energy | D4 |
| Push Button 4 | Metallic Character | D5 |
| RGB LEDs | Signal | PWM Pins |
| OLED Display | SDA | A4 |
| OLED Display | SCL | A5 |
| Buzzer | Positive | D6 |
System Workflow
Student Presses Button
          ↓
Arduino Processes Input
          ↓
Corresponding Trend Selected
          ↓
LED Animations Activated
          ↓
Display Shows Explanation


4
Why Build a Periodic Trends LED Board?
Periodic trends are often difficult because students cannot see changes occurring across the periodic table.
This model helps students:
✅ Visualize periodic changes.
✅ Understand relationships between elements.
✅ Improve memory retention.
✅ Learn through interaction.
Objectives of the Project
- Demonstrate periodic trends visually.
- Improve understanding of chemistry concepts.
- Integrate electronics with chemistry education.
- Promote STEM learning.
Bill of Materials (BOM)
| Component | Quantity | Purpose |
|---|---|---|
| Arduino Uno | 1 | Main controller |
| RGB LEDs | 118 | Element illumination |
| Push Buttons | 4 | Trend selection |
| OLED Display | 1 | Displays explanations |
| Buzzer | 1 | Audio feedback |
| Resistors | Several | Current limiting |
| Acrylic Board | 1 | Project structure |
| Jumper Wires | Many | Connections |
| Battery | 1 | Power supply |
Estimated Cost
| Item | Cost |
|---|---|
| Arduino Uno | $8 |
| LEDs | $10 |
| OLED Display | $5 |
| Buttons | $3 |
| Miscellaneous | $10 |
Estimated Total Cost: $30–40
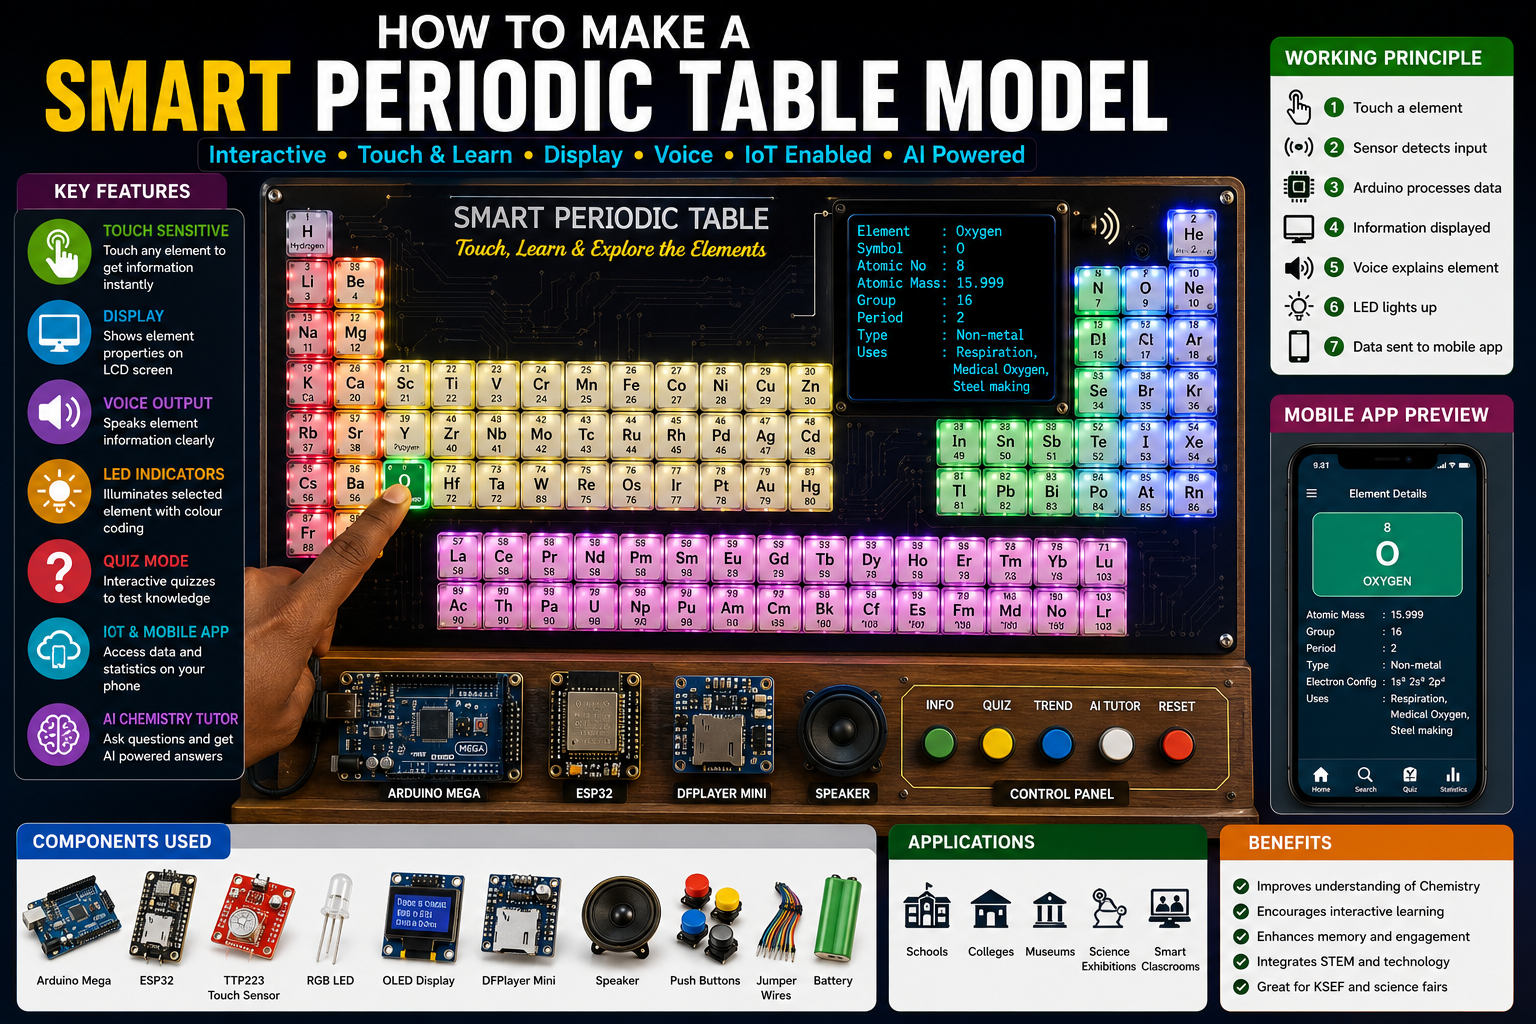
Components Overview


6
Key Features
✅ Interactive learning
✅ Multiple periodic trends visualization
✅ LED animations
✅ Audio explanations
✅ Portable educational model
Model Design
The model consists of:
Upper Section
- Large periodic table poster
- Embedded LEDs beneath elements
Middle Section
- Trend selection buttons
Lower Section
- Arduino and control circuit


Block Diagram
Push Buttons
       ↓
Arduino Uno
       ↓
OLED Display
       ↓
LED Matrix
       ↓
Buzzer
Circuit Diagram Connections
Push Buttons
- Atomic Radius → D2
- Electronegativity → D3
- Ionization Energy → D4
- Metallic Character → D5
OLED Display
- SDA → A4
- SCL → A5
Buzzer
- Positive → D6


Step-by-Step Guide
Step 1: Construct the Board
Prepare an acrylic or wooden board.
Print and mount the periodic table.
Step 2: Install LEDs
Place LEDs under each element.
Use colours to distinguish categories.
Step 3: Install Buttons
Create buttons for:
- Atomic Radius
- Electronegativity
- Ionization Energy
- Metallic Character
Step 4: Upload Arduino Program
The Arduino should:
- Detect selected trend.
- Activate LED animations.
- Display explanations.
Working Principle
1. Atomic Radius Trend
When the Atomic Radius button is pressed:
LEDs illuminate showing:
Trend:
Increases ↓
Decreases →
Students observe:
- Atomic radius increases down groups.
- Atomic radius decreases across periods.
2. Electronegativity Trend
When selected:
Increases ↑ →LEDs move towards Fluorine.
3. Ionization Energy Trend
LED animations show:
Increases ↑ →4. Metallic Character Trend
LEDs indicate:
Increases ↓ ←Example OLED Display
PERIODIC TREND

Atomic Radius

Increase:
↓ Down Group

Decrease:
→ Across Period
System Flowchart
START
   ↓
Wait for Button Press
   ↓
Which Trend Selected?
   ↓
Activate LEDs
   ↓
Display Explanation
   ↓
Sound Buzzer
   ↓
Repeat


Chemistry Concepts Demonstrated
Periodic Trends Covered
✅ Atomic Radius
✅ Electronegativity
✅ Ionization Energy
✅ Electron Affinity
✅ Metallic Character
✅ Reactivity Trends
Applications
This project can be used in:
- Schools
- Chemistry laboratories
- Science exhibitions
- Museums
- Smart classrooms
Advantages
✔ Makes learning easier.
✔ Attractive visual representation.
✔ Interactive.
✔ Encourages self-learning.
✔ Supports competency-based learning.
Future Improvements
You can improve this project by adding:
Voice Module
Explain trends verbally.
ESP32 Mobile Application
Control using smartphones.
Artificial Intelligence
Ask questions and receive explanations.
Holographic Atoms
Display atomic structures.
Quiz Mode
Students answer chemistry questions.
How to Fix Common Arduino Upload Errors
Error: Board Not Uploading
Solutions
- Verify COM port.
- Replace USB cable.
- Install drivers.
Error: LEDs Not Working
Solutions
- Check polarity.
- Verify resistor values.
Error: OLED Not Displaying
Solutions
- Verify SDA/SCL connections.
- Check I2C address.
Real Project Prototype
Final Thoughts
Learning how to make a Periodic Trends LED Board is one of the best Grade 10 Chemistry STEM projects.
By combining Chemistry, Arduino, ICT, and Engineering, students can transform abstract periodic trends into an engaging visual learning experience.